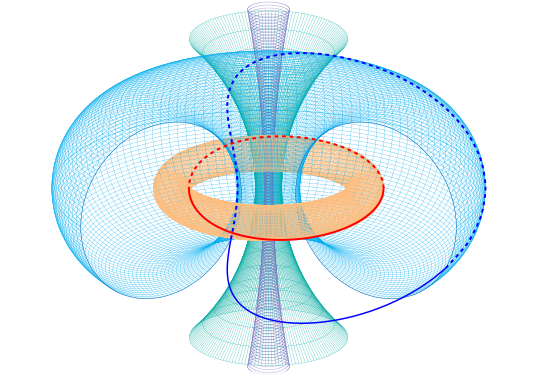
文件: AT Hopf.svg

此 SVG 文件的 PNG 预览的大小: 538×375 像素. 其他分辨率: 320×223 像素.
原始文件 (SVG 文件, 尺寸为 538 × 375 像素, 文件大小: 1.56 MB)
LaTeX 源代码:
\tdplotsetmaincoords{69}{0}

\begin{tikzpicture}[scale=2.5,tdplot_main_coords,arrow/.style={->,>=stealth,thick}]
    %Tall green
    \foreach \k/\l in {27/25.5}{
    \foreach \y in {135,140,...,225}
    {\draw[scale=0.1,domain=-180:180,smooth,variable=\x,Emerald,very thin]  plot
        ({(\k+ \l*cos(\y))*cos(\x)}, {(\k+ \l*cos(\y))*sin(\x)}, {\l*sin(\y)});}
    \foreach \x in {2.5,5,...,360}
    {\draw[scale=0.1,domain=135:225,smooth,variable=\y,Emerald,very thin]  plot
        ({(\k+ \l*cos(\y))*cos(\x)}, {(\k+ \l*cos(\y))*sin(\x)}, {\l*sin(\y)});}
    }

    \foreach \k/\l in {125/124.5}{
    \foreach \y in {170,172,...,190}
    {\draw[scale=0.1,domain=-180:180,smooth,variable=\x,Periwinkle,dotted]  plot
        ({(\k+ \l*cos(\y))*cos(\x)}, {(\k+ \l*cos(\y))*sin(\x)}, {\l*sin(\y)});}
    \foreach \x in {2.5,5,...,360}
    {\draw[scale=0.1,domain=170:190,smooth,variable=\y,Periwinkle,dotted]  plot
        ({(\k+ \l*cos(\y))*cos(\x)}, {(\k+ \l*cos(\y))*sin(\x)}, {\l*sin(\y)});}
    }

    %Orange first
    \foreach \y in {5,10,...,360}
    {\draw[scale=0.1,domain=-180:180,smooth,variable=\x,orange!50,thin]  plot
        ({(11 + 2*cos(\y))*cos(\x)}, {(11 + 2*cos(\y))*sin(\x)}, {2*sin(\y)});}
    \foreach \x in {2.5,5,...,360}
    {\draw[scale=0.1,domain=-180:180,smooth,variable=\y,orange!50,thin]  plot
        ({(11 + 2*cos(\y))*cos(\x)}, {(11 + 2*cos(\y))*sin(\x)}, {2*sin(\y)});}

    %BLUE
    \foreach \y in {0,2.5,...,360}
    {\draw[scale=0.1,domain=-30:210,smooth,variable=\x,cyan,very thin]  plot
        ({(14 + 10.5*cos(\y))*cos(\x)}, {(14 + 10.5*cos(\y))*sin(\x)}, {10.5*sin(\y)});}
    \foreach \x in {-30,-27.5,...,210}
    {\draw[scale=0.1,domain=-180:180,smooth,variable=\y,cyan,very thin]  plot
        ({(14 + 10.5*cos(\y))*cos(\x)}, {(14 + 10.5*cos(\y))*sin(\x)}, {10.5*sin(\y)});}

    \foreach \x in {-30,210}
    {\draw[scale=0.1,domain=-180:180,smooth,variable=\y,RoyalBlue]  plot
        ({(14 + 10.5*cos(\y))*cos(\x)}, {(14 + 10.5*cos(\y))*sin(\x)}, {10.5*sin(\y)});}

    %Orange second
    \foreach \y in {5,10,...,360}
    {\draw[scale=0.1,domain=-180:0,smooth,variable=\x,orange!50,thin]  plot
        ({(11 + 2*cos(\y))*cos(\x)}, {(11 + 2*cos(\y))*sin(\x)}, {2*sin(\y)});}
    \foreach \x in {-2.5,-5,...,-180}
    {\draw[scale=0.1,domain=-180:180,smooth,variable=\y,orange!50,thin]  plot
        ({(11 + 2*cos(\y))*cos(\x)}, {(11 + 2*cos(\y))*sin(\x)}, {2*sin(\y)});}

    \foreach \x in {0}{
        \draw[scale=0.1,domain=-30:210,smooth,variable=\y,blue,ultra thick,dashed]  plot
            ({(14 + 10.5*cos(\y+\x))*cos(\y)}, {(14 + 10.5*cos(\y+\x))*sin(\y)}, {10.5*sin(\y+\x)});}
    \foreach \x in {0}{
        \draw[scale=0.1,domain=210:330,smooth,variable=\y,blue,very thick]  plot
            ({(14 + 10.5*cos(\y+\x))*cos(\y)}, {(14 + 10.5*cos(\y+\x))*sin(\y)}, {10.5*sin(\y+\x)});}

    \foreach \x in {0}{
        \draw[scale=0.1,domain=0+\x:180+\x,smooth,variable=\y,red,dashed,ultra thick]  plot
            ({(11 + 2*cos(\y+\x))*cos(\y)}, {(11 + 2*cos(\y+\x))*sin(\y)}, {2*sin(\y+\x)});
        \draw[scale=0.1,domain=180+\x:360+\x,smooth,variable=\y,red,ultra thick]  plot
            ({(11 + 2*cos(\y+\x))*cos(\y)}, {(11 + 2*cos(\y+\x))*sin(\y)}, {2*sin(\y+\x)});}
\end{tikzpicture}
文件历史
单击某个日期/时间查看对应时刻的文件.
| 日期/时间 | 缩略图 | 大小 | 用户 | 备注 | |
|---|---|---|---|---|---|
| 当前 | 2021 年 3 月 6 日 (六) 23:19 | | 538 × 375(1.56 MB) | BCJ(讨论 | 贡献) |
您不可以覆盖此文件.
文件用途
以下2 个页面使用本文件: